
UTICAJ ODABRANIH FAKTORA NA STRUKTURU KAPITALA GRAĐEVINSKIH KOMPANIJA

Apstrakt
Struktura kapitala se odnosi na kombinaciju duga i kapitala koji kompanije koriste za finansiranje svog poslovanja. On određuje ravnotežu između rizika i prinosa za akcionare i utiče na finansijsku stabilnost kompanije i cenu kapitala. Predmet ove studije obuhvata uzorak od 42 građevinske kompanije koje posluju na tržištu Srbije posmatrano u periodu od 2006. do 2023. godine. Za analizu efekata odabranih varijabli na nivo zaduženosti korišćene su tri zavisne varijable u vidu indikatora ukupnog duga, kratkoročnog duga i dugoročnog duga preduzeća. Cilj studije je da se razumeju efekti i značaj uticaja odabranih mikroekonomskih i makroekonomskih varijabli na nivo zaduženosti privrednih subjekata. Analiza uključuje upotrebu statičkih i dinamičkih ekonometrijskih modela za analizu panel podataka. Rezultati su ukazali na statističku značajnost varijabli kao što su likvidnosti, profitabilnosti, opipljivosti, poreskog štita i bruto domaćeg proizvoda na nivo zaduženosti, kao i značajan efekat zakasnelih verzija indikatora duga, što je ukazivalo na postojanje perzistentnosti duga i podržalo dinamiku i karakter formulacije modela. Autori očekuju da će rezultati ovog rada dati kreatorima politike i menadžerima informacije za uspostavljanje adekvatne strukture kapitala u preduzeću kroz razumevanje prirode efekata određenih mikroekonomskih i makroekonomskih varijabli, kao i za dokazivanje primene određenih teorija strukture kapitala.
Članak
Introduction
The construction sector is an important part of a country's economy, driving industrial expansion, innovation and employment. Capital structure consists of a combination of debt and equity that a company uses to finance its operations and expansion. This balance between borrowed and equity capital is crucial because it affects the company's risk, cost of capital and financial flexibility. Too much debt increases a company's debt, making things unpredictable for creditors and business owners. Capital structure research focuses on determining the optimal balance of equity and debt. It is almost impossible to determine which source of capital is best for financing certain commercial activities of the company (Gajdosikova, et al., 2023). A number of different theories have been developed to examine the capital structure of firms, for example, irrelevance theory, trade-off theory, and pecking-order theory (Modigliani & Miller, 1963; Kraus & Litzenberger, 1973; Myers & Majluf, 1984). The most popular of these theories are trade-off theory and hierarchical order or differently known as pecking-order theory, and most of the work written on this topic attempts to confirm the relevance of these theories. One of the objectives of this study is to analyze the way in which these two theories are applied in the case of the construction industry in Serbia. According to trade-off theory, an adequate amount of debt occurs when the marginal benefit of debt financing equals the marginal cost. However, the pecking-order theory states that companies should prioritize internal financing over borrowed capital. Firms first prioritize internal money, then issue external debt, and finally provide external capital (Myers & Majluf, 1984).
It is often stated that economic policy uncertainty combined with firm characteristics is very important in shaping firms' debt financing decisions (Li & Qiu, 2021). Countries with the most developed financial systems tend to produce the most important empirical research and ideas on capital structure. Capital structures of companies in developed and developing countries differ. Among the many country-specific factors that influence capital structure decisions are the characteristics of legal and tax systems, corporate governance procedures, and financial systems of different countries (Kuč & Kaličanin, 2021). Recent studies conducted on the topic of the capital structure of companies deal with the research of the impact of certain factors on the level of company debt (Frank & Goyal, 2009; Raval & Dave, 2021), as well as the impact of the capital structure on other company performances (Co, Uong & Nguyen, 2021; Ilie & Vasiu, 2022). Mostly the studies involve some kind of data segmentation such as country, country group and industry sector specific data segmentation. Some studies conducted investigations of the relationship of certain factors in the case of developed countries such as, (Gajdosikova, et al., 2023; Li & Qiu, 2021; Chen, et al., 2022; Mokhova & Zinecker, 2014; Stöckl & Winner, 2013), while other articles investigated developing countries (Alrabba, Ahmad & Hamadneh, 2019; Amponsah, Michael & Hughes, 2013; Ilie & Vasiu, 2022; Jõeveer, 2013). Investigating capital structure and the effects of financial leverage in so-called transition economies is still of interest. Due to different circumstances, this problem is experienced differently in each country. The length of the privatization process, the level of development of the capital market, the availability of various sources of financing, the level of investor protection, the stability of the legal system and the standard of management are the most important of them. Each of these features can affect certain organizations to a different degree, depending on the country (Malinić et al., 2013).
The main objective of this study is to better understand how certain microeconomic factors affect the leverage levels of companies. The article is divided into five main parts. After the introduction, there will be a review of the literature, where the findings of studies that investigated similar relationships between capital structure and relevance indicators will be presented and commented on. The methodology and data are presented in the third part of the study. This section includes an overview of the data used, data sampling, and a presentation of the diagnostic tests and panel data regression models used. In the fourth part of the study, an econometric test was presented along side the regression analysis. In the last part of the study presents certain conclusions and recommendations by the authors. The basis of this study is the construction sector of Serbia and the time frame from 2006 to 2023. The study aims to prove the applicability of both trade-off theory and the pecking-order theory and to help better understand the nature and direction of influence of certain capital structure factors. Limitations of the study are the absence of companies from other industrial sectors in the country, as well as the absence of some macroeconomic factors that are not included in this study.
Literature review
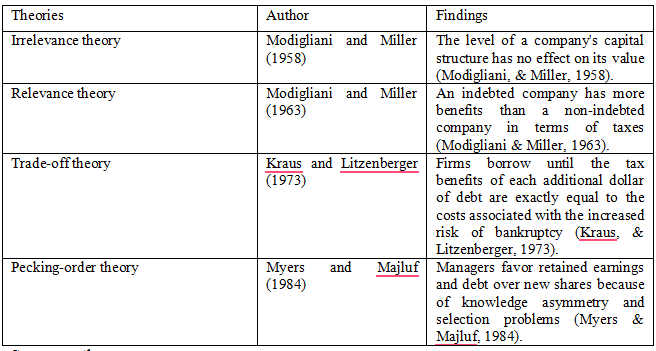
Regarding the theory of capital structure of companies, the authors in table no. 1 list the most relevant theories of capital structure investigated in this paper. The table also shows the main postulates of the mentioned theories.
Table 1. Theories of the company's capital structure
Source: authors
The process of choosing a form of financing is often influenced by various factors, including company size, legal structure, profit margin, industry in which it operates, macroeconomic climate, business regulatory environment, and credit policy (Gajdosikova, et al., 2023). A study investigating Brazilian manufacturing companies found that private companies were more inclined to use subsidized financing than public companies (Eça, Costa Gomes & Valle, 2022). Various studies investigating companies in the Turkish textile industry found that firm size, profitability, liquidity, and asset tangibility negatively affected the leverage ratio, while non-debt tax shields, growth prospects, earnings volatility, and GDP growth had a positive effect. The research also confirmed the results of the pecking-order theory (Ersoy, 2022). One study, which investigated Chinese listed micro-enterprises, found that market competition, high-tech enterprise status, and audit quality influence the relationship between enterprise digital transformation and debt financing costs (Sun, et al., 2022).
The results of the study, which used companies listed on the Amman Stock Exchange for the data sample, showed that ROA was significantly negatively affected by short-term and total debt levels, but positively by company size and asset growth (Alrabba, Ahmad & Hamadneh, 2019). Comparable research results of companies listed on the Suadi Stock Exchange showed that capital structure ratios significantly reduce the return on assets (ROA) and return on equity (ROE) of the company (Boshnak, 2023). The importance of debt for the operational success of a company must be emphasized when talking about the capital structure and its importance. The impact of the deleveraging policy on the risk of corporate debt default is particularly pronounced for companies that have developed sectors with non-state ownership, low operational performance and backward capacities (Chen, et al., 2022). A study investigating companies listed on the Romanian stock exchange found that ROE had the most significant negative relationship with the debt-to-equity indicator (Ilie & Vasiu, 2022). From the perspective of capital structure theory, it has been found that the pecking-order theory is most useful for small, publicly traded industrial companies, especially in an unstable economic climate (Köksal & Orman, 2015).
In the case of Indian manufacturing firms, the debt ratio was found to be positively correlated with variables such as asset composition, business risk and return on assets, while the debt ratio was negatively correlated with firm size and debt servicing capacity (Sofat & Singh, 2017). In a study on large Korean companies, it was determined that indebtedness is negatively and significantly influenced by profitability and liquidity, measured by total, short-term and long-term debt ratios (Tulcanaza Prieto & Lee, 2019). A study conducted in Albania on the capital structure of unlisted companies revealed that liquidity, profitability and size have a significant impact on leverage (Cekrezi, 2013). As a result of the high cost of debt financing and the increased vulnerability of the economy to shocks, highly leveraged companies are more vulnerable to insolvency, according to the results of a study conducted on listed companies on the Ghana Stock Exchange (Essel, 2023). In the case of Australian firms, industry-specific variables have been found to influence the establishment of capital structures both directly and indirectly (Li & Islam, 2019).
A study investigating Kuwaiti firms produced results that supported the hierarchy hypothesis more than the trade-off theory. Some findings of this study supported the importance of expansion prospects and profitability (Sbeti & Moosa, 2012). According to a study that examines the factors that influence the capital structure in post-transition economies, more successful companies and those with more tangible assets use less debt financing, it was shown that larger companies and those with higher investments in fixed assets show a higher level of indebtedness (Arsov & Naumoski 2016).
Based on the review of relevant literature in the field of capital structure, the authors have formulated the following research hypotheses:
H1 - There is a statistically more significant effect of microeconomic variables than macroeconomic variables on the levels of total, short-term and long-term debt.
H2 – There is a statistically significant effect of debt persistence in the case of companies in the construction sector.
Methodology and data
This study analyzes the influence of certain microeconomic variables on the indebtedness levels of selected construction companies in the Republic of Serbia. The panel data consists of unbalanced data from 42 construction companies. The analysis covers the period from 2006 to 2023, uses annual data and includes 609 observations. The main dependent variables used are the total debt-to-assets indicator, as well as the short-term debt-to-assets indicator and the long-term debt-to-assets indicator. Indicators of liquidity, profitability, size, tax shield, non-tax shield and tangibility are used as independent variables, while macroeconomic indicators of gross domestic product and inflation are used as control variables. In the table below, the authors show more precisely the variables used in the empirical research:
Table 2. Used variables

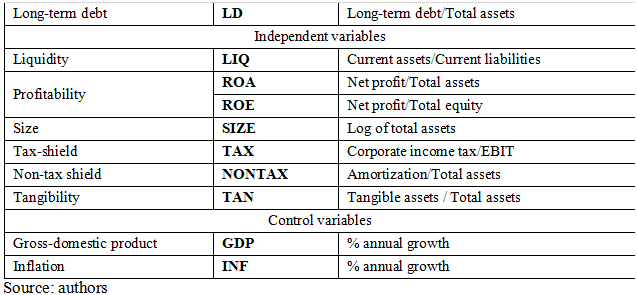
Under table no. 2, the authors present the main models of the study. The study uses both static and dynamic modeling using the programming language R. The main process of the study consists of diagnostic tests at baseline. Diagnostic tests used are panel unit root tests, multicollinearity tests using the correlation matrix, Breusch-Pagan homoscedasticity test, F test for individual effects, Sargan test, and autocorrelation tests. After the results of the diagnostic tests, the selection process follows. According to the results, the authors choose the most adequate static or dynamic model for interpretation, similar to (Saif-Alyousfi, et al., 2020).
The static model consists of:
 (1)
(1)
 (2)
(2)
 (3)
(3)
Where is:
TDit = Total debt of company i at time t
SDit = Short-term debt of the company i at time t
LDit = Long-term debt of the company i at time t
LIQit = Liquidity ratio of company i at time t
ROAit = Coefficient of return on the assets of the company i at time t
ROEit = Coefficient of return on capital of the company i at time t
SIZEit = Logarithm of the total assets of the company i at time t
TAXit = Indicator of the company's tax shield i at time t
NONTAXit = Tax indicator that is not owed by the company and at time t
TANit = Coefficient of tangibility of the company i at time t
GDPt = Gross domestic product at time t
INFt = Inflation rate at time t
The dynamic model of equation (1) above can be represented as:
 (4)
(4)
 (5)
(5)
 (6)
(6)
Where is:
TDeit-1 = Dynamic indicator of total company debt i at time t -1
SDeit-1 = Dynamic indicator of the company's short-term debt i at time t -1
LDeit-1 = Dynamic indicator of the company's long-term debt i at time t -1
LIQit = Liquidity ratio of company i at time t
ROAit = Coefficient of return on the assets of the company i at time t
ROEit = Coefficient of return on capital of the company i at time t
SIZEit = Logarithm of the total assets of the company i at time t
TAXit = Indicator of the company's tax shield i at time t
NONTAXit = Tax indicator that is not owed by the company and at time t
TANit = Coefficient of tangibility of the company i at time t
GDPt = Gross domestic product at time t
INFt = Inflation rate at time t
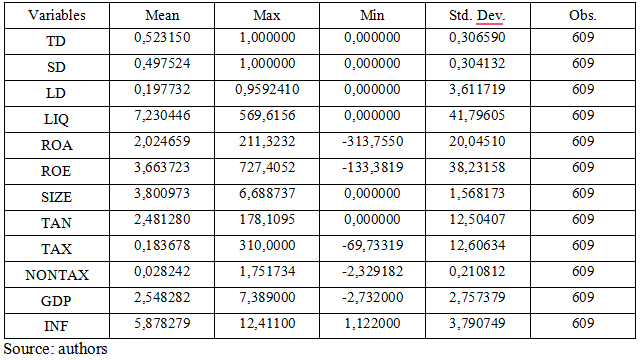
Table no. 3 shows a descriptive analysis of the variables used. The results of the analysis show that the biggest change is noticeable in the case of liquidity, total debt and short-term debt. The volatility of these indicators can be seen through the standard deviation coefficients that indicate the largest gap between the minimum and maximum amount. In the case of total debt, the mean value of 0.523 indicates that the average construction company selected from this sample finances its assets using mostly debt compared to equity. On the other hand, a high standard deviation of long-term debt indicates high volatility, meaning that some companies have very high levels of long-term debt while others have none. In the case of total and short-term debt, the analysis shows a more normal distribution between the minimum and maximum values.
Table 3. Descriptive statistics
Findings
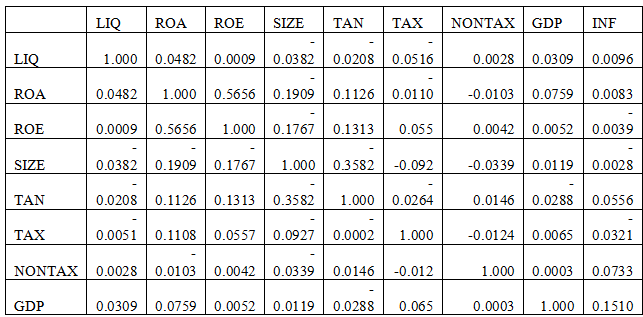
Stationarity and multicollinearity are some of the main requirements that need to be met in order to derive a valid regression model. In the case of multicollinearity, a common method for identifying is the use of a correlation matrix. Multicollinearity is a statistical concept that occurs when two or more independent variables in a model show a high correlation. The results can be seen in table no. 4, where the highest value of the correlation coefficient does not exceed the value of 0.60, which indicates the absence of multicollinearity between independent variables.
Table 4. Correlation matrix

On the other hand, stationarity is also an important condition to be met in order to implement an adequate regression model. In the case of the static models applied in this study (POLS, FE, RE) stationarity is necessary, while in the case of the dynamic model (GMM), stationarity is not a necessary condition. Due to the nature of panel data, Levin, Lin and Chu, Breitung and Im, Pesaran and Shin tests were applied in this study. Results in table no. 5 indicate the stationarity of the dependent variables of total debt and short-term debt at the level, while in the case of long-term debt, stationarity is present after the first differentiation. Stationarity in the case of independent variables is present at the level in the case of liquidity, profitability, size, tangibility and gross domestic product, while in the case of inflation, stationarity is present after the first differentiation.
Table 5. Unit root tests
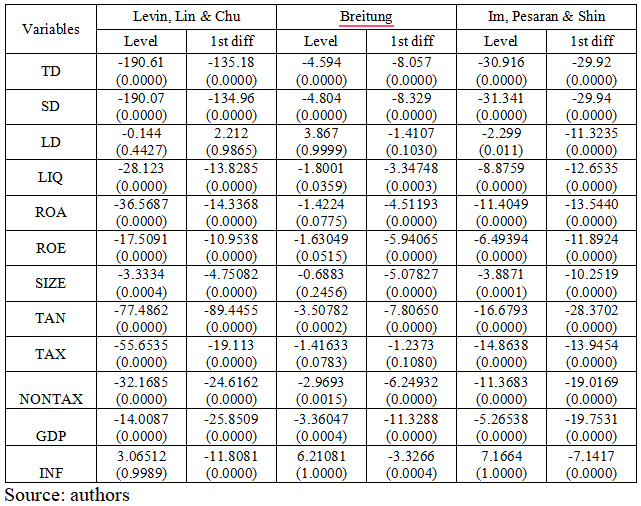
Table no. 6 shows the results of the conducted research. The composition is the results of static and dynamic models. The static models used include ordinary least squares (POLS), the fixed effects model (FE) and the random effects model (RE) on the example of the dependent variable of total debt. First, the results of the POLS model are presented, showing the statistical significance of the effects at the 1%, 5% and 10% levels of independent variables such as liquidity (LIQ), return on assets (ROA), size (SIZE), gross domestic product (GDP) and inflation (INF). The results of the individual effects F test show statistical significance, indicating a higher validity of the fixed effects (FE) model compared to the POLS method. The results of FE methods indicated a significant influence of liquidity (LIQ), tangibility (TAN), tax shield (TAX), gross domestic product (GDP) and inflation (INF). The Hausman test was conducted to determine the validity of fixed effects (FE) and random effects (RE) models. The authors conclude that the statistic consistently and effectively accepts the null hypothesis of the random effects model. In the case of the random effects model, the variables liquidity (LIQ), tangibility (TAN), tax shield (TAX), gross domestic product (GDP) and inflation (INF) showed a statistically significant effect.
The results of the Breusch-Pagan heteroscedasticity test show the rejection of the null hypothesis of homoscedasticity of the data and indicate the necessity of using dynamic models for greater robustness of the data, similar to (Paredes Gómez, Ángeles Castro & Flores Ortega, 2016). The results of the generalized method of moments (GMM) model show a statistically significant effect of the dynamic variable, lag version of total debt, liquidity (LIQ), tax shield (TAX) and gross domestic product (GDP). A positive effect was shown by the lag version of total debt, where a growth of 1% contributes to an increase in total debt by 0.3847%. These findings indicate the existence of debt persistence and support the use of dynamic modeling, similar to (Stöckl & Winner, 2013). A 1% increase in liquidity and the level of tax shield causes an increase in the level of total debt by 0.2786% and 0.2861% respectively, similar to the findings of (Amponsah, Michael & Hughes, 2013). These tax shield findings follow the main principles of the “trade-off” theory and the benefits of tax shields first introduced by Modigliani and Miller (1963). Growth of gross domestic product by 1% results in debt growth of 0.2502%, which points to the conclusion that companies from the construction sector in periods of economic expansion take on additional debt. The final diagnostic test is shown in table no. 6, where the Sargan test indicates the validity of using the dynamic GMM model in the case of total debt due to not rejecting the null hypothesis (Roodman, 2009).
Table 6. Results of the total debt regression model

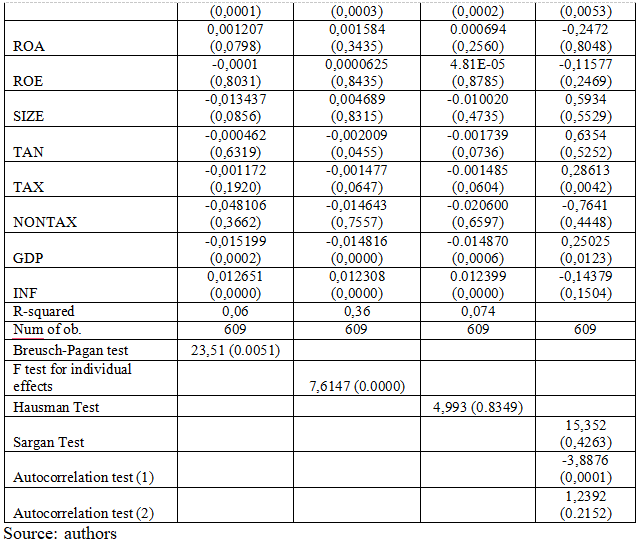
Table no. 7 shows the results on the example of the dependent variable of short-term debt. First, the results of the POLS model are presented, showing the statistical significance of the effects at the 1%, 5% and 10% levels of independent variables such as liquidity (LIQ), return on assets (ROA), return on equity (ROE), size (SIZE), gross domestic product (GDP) and inflation (INF). The results of the individual effects F test show statistical significance, indicating a higher validity of the fixed effects (FE) model compared to the POLS method. The results of FE methods indicated a significant influence of liquidity (LIQ), tangibility (TAN), tax shield (TAX), gross domestic product (GDP) and inflation (INF). The Hausman test was conducted to determine the validity of fixed effects (FE) and random effects (RE) models. The authors conclude that the statistic consistently and effectively accepts the null hypothesis of the random effects model. In the case of the random effects model, the variables liquidity (LIQ), return on assets (ROA), tangibility (TAN), tax shield (TAX), gross domestic product (GDP) and inflation (INF) showed a statistically significant effect. The dynamic model (GMM) indicates the statistical significance of the effects of the dynamic variable late version of short-term debt, tax shield (TAX) and gross domestic product (GDP). The results of the Breusch-Pagan heteroskedasticity test do not show the rejection of the null hypothesis of homoscedasticity of the data and indicate the validity of the static models in the case of short-term debt. In table no. 7, the Sargan test which, due to the rejection of the null hypothesis, indicates a greater validity of using static models in the case of short-term debt.
The random effects model (REM), which according to the diagnostic tests proved to be the most valid, showed that an increase in liquidity (LIQ) of 1% causes a decrease in the level of short-term debt by 0.0009%. A 1% increase in return on assets (ROA) causes an increase of 0.001%, which is different from the findings of Kuč & Kaličanin (2021), who found a negative relationship between return on assets and short-term debt in the case of companies from Serbia. A 1% increase in tangibility indicators (TAN) and tax shield (TAX) leads to a decrease in the value of short-term debt by 0.002% and 0.001%, respectively. Growth of gross domestic product (GDP) by 1% results in a decrease in indebtedness of 0.0160%, which points to the conclusion that companies from the construction sector reduce the level of short-term debt in periods of economic expansion. It is also shown that an increase in inflation of 1% acts as an increase in short-term debt by 0.122%.
Table 7. Results of the short-term debt regression model
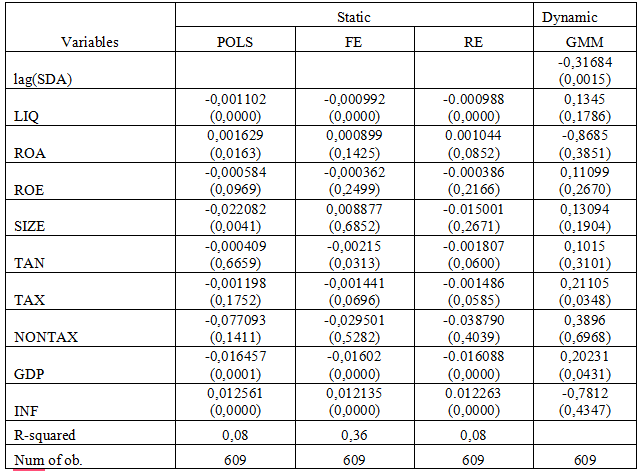
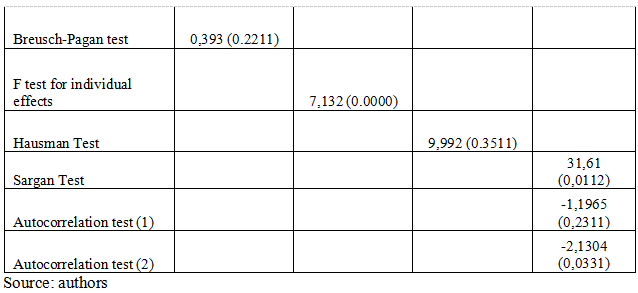
Table no. 8 shows the results of the long-term debt model. First, the results of the POLS model are presented, showing the statistical significance of the effects at the 1%, 5% and 10% levels of independent variables such as return on assets (ROA), return on equity (ROE) and tangibility (TAN). The results of the F test of individual effects do not show statistical significance, which indicates a higher validity of the POLS model compared to the fixed effects (FE) model. The results of FE methods indicated a significant effect of return on assets (ROA), return on equity (ROE) and tangibility (TAN). The Hausman test was conducted to determine the validity of fixed effects (FE) and random effects (RE) models. The authors conclude that the statistic consistently and effectively rejects the null hypothesis of the random effects model. In the case of the random effects model, the return on assets (ROA), return on equity (ROE) and tangibility (TAN) variables also showed a statistically significant effect.
The results of the Breusch-Pagan heteroscedasticity test show the rejection of the null hypothesis of homoscedasticity of the data and indicate the necessity of using dynamic models for greater robustness of the data, similar to (Paredes Gómez, Ángeles Castro & Flores Ortega, 2016). The results of the Generalized Method of Moments (GMM) model show a statistically significant effect of the dynamic variable of the lag version of long-term debt. These findings indicate the existence of debt persistence and are consistent with the idea of debt reduction or adjustment to return to the optimal debt ratio. The findings are consistent with the postulates of "trade-off" theories and support the use of dynamic modeling in the case of long-term debt. The final diagnostic test is shown in table no. 8, where the Sargan test indicates the validity of using the dynamic GMM model in the case of long-term debt.
Table 8. Results of the long-term debt regression model

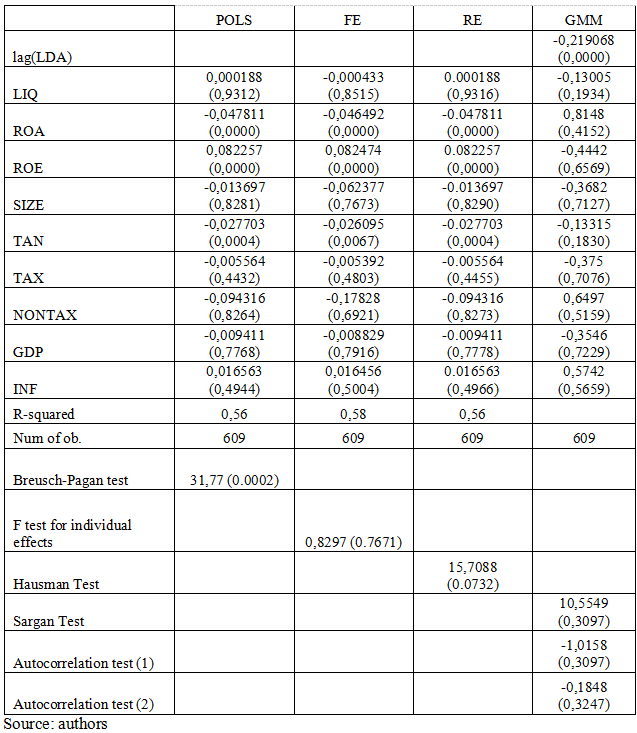
The results of the regression model point to the confirmation of both research hypotheses. Microeconomic factors showed a more statistically significant effect on the level of total, short-term and long-term debt of companies from the construction sector and thus confirmed the first hypothesis H1 of this research. The results also indicated the presence of debt persistence in the case of all three models, total, short-term and long-term debt, thus confirming the second hypothesis H2.
Conclusion
The study comprehensively analyzed the determinants of total debt, short-term debt and long-term debt using static (POLS, FE and RE) and dynamic (GMM) models. The results consistently showed the importance of several financial variables, such as liquidity, tax shield and gross domestic product in the case of total and short-term debt, while in the case of long-term debt, only the lagged version of the long-term debt variable showed a statistically significant effect. Using various diagnostic tests, the dynamic model was chosen as the most adequate for presenting the results in the case of total debt and long-term debt, while the Breusch-Pagan heteroscedasticity test highlighted the greater adequacy of the static random effects model for the example of short-term debt. The results suggest a special approach to debt management in construction companies in Serbia. The findings of the total debt model point to the application of the trade-off theory, which speaks of the ability of companies to bear the additional risk and burden of borrowing at a higher level of liquidity and the level of the tax shield. The results of the short-term debt model point more to the application of the pecking-order theory, which points to a greater concentration of companies on using their own funds in relation to borrowing short-term debt. In the case of the third model of long-term debt, the effect of debt constancy was confirmed, which turned out to be negative, indicating that companies with higher past long-term debt tend to issue less current long-term debt, which is in line with the idea of reducing indebtedness or adjusting to return to the optimal debt ratio, which is advocated by the trade-off theory. The main scientific contribution of this study is reflected in the research of the practical application of various theories of capital structures on the example of construction companies, as well as a deeper understanding of the effects of the determinants of capital structures. The construction sector of Serbia is relatively unexplored from the aspect of research in the field of capital structure. Also, the results of this study, which indicated the flexibility of various effects of microeconomic and macroeconomic factors as well as the presence of a dynamic effect of indebtedness, contribute to the future development of heterogeneous and proactive capital structure strategies of companies from capital intensive sectors such as construction. The study provides robust evidence on the determinants of debt at different maturities, confirming the relevance of dynamic modeling techniques and the applicability of financial theories in understanding corporate debt behavior. These insights are particularly valuable to policymakers and financial managers in formulating strategies to optimize capital structure decisions.
Reference
2.Amponsah, A., Michael, A., & Hughes, N. D. (2013). The effects of capital structure on profitability of listed firms in Ghana. European Journal of Business and Management, 5(31), 215-230.
3.Arsov, S., & Naumoski, A. (2016). Determinants of capital structure: An empirical study of companies from selected post-transition economies. Zbornik radova Ekonomskog fakulteta u Rijeci: časopis za ekonomsku teoriju i praksu, 34(1), 119-146.
4.Attia, E. F., Ezz Eldeen, H. H., & Daher, S. S. (2023). Size-threshold effect in the capital structure–firm performance nexus in the MENA region: A dynamic panel threshold regression model. Risks, 11(2), 23.
5.Boshnak, H. (2023). The impact of capital structure on firm performance: evidence from Saudi-listed firms. International Journal of Disclosure and Governance, 20(1), 15-26.
6.Cekrezi, A. (2013). Impact Of Firm Specific Factors On Capital Structure Decision: An Empirical Study Of Albanian Firms. European Journal of Sustainable Development, 2(4), 135-135.
7.Chen, K., Guo, W., Kang, Y., & Wang, J. (2022). Does the deleveraging policy increase the risk of corporate debt default: evidence from China. Emerging Markets Finance and Trade, 58(3), 601-613.
8.Co, H. T. T., Uong, T. T. M., & Nguyen, C. V. (2021). The impact of capital structure on firm’s profitability: A case study of the rubber industry in Vietnam. Journal of Asian Finance, Economics and Business, 8(7), 469-476.
9.Demirgüç-Kunt, A., Peria, M. S. M., & Tressel, T. (2020). The global financial crisis and the capital structure of firms: Was the impact more severe among SMEs and non-listed firms? Journal of Corporate Finance, 60, 101514.
10.Đaković, Kalaš & Inđić, (2024). Analiza uticaja mikroekonomskih pokazatelja na nivo duga komapnija: Primer kompanija listiranih na beogradskoj berzi. Akcionarstvo, 30 (1), 197-216.
11.Eça, J. P. A., da Costa Gomes, M., & do Valle, M. R. (2022). Debt structure and its determinants: An analysis of large Brazilian manufacturing companies. Revista Contemporânea de Contabilidade, 50(19), 143-160.
12.Ersoy, E. (2022). An Empirical Study on the Determinants of the Capital Structure in Turkish Textile and Apparel Firms. Sosyoekonomi, 30(54), 199-213.
13.Essel, R. E. (2023). The Effect of Capital Structure on Corporate Performance: Panel Empirical Evidence of an Emerging Capital Market. Journal of African Business, 1-40.
14.Frank, M.Z. and Goyal, V.K. (2009), “Capital structure decisions: which factors are reliably important?”, Financial Management, 38 (1), 1-37.
15.Gajdosikova, D., Lăzăroiu, G., & Valaskova, K. (2023). How Particular Firm-Specific Features Influence Corporate Debt Level: A Case Study of Slovak Enterprises. Axioms, 12(2), 183.
16.Gajdosikova, D., Valaskova, K., Kliestik, T., & Kovacova, M. (2023). Research on Corporate Indebtedness Determinants: A Case Study of Visegrad Group Countries. Mathematics, 11(2), 299.
17.Ilie, L., & Vasiu, D. (2022). Capital structure and profitability. The case of companies listed in Romania. Studies in Business and Economics, 17(3), 100-112.
18.Jõeveer, K. (2013). Firm, country and macroeconomic determinants of capital structure: Evidence from transition economies. Journal of Comparative Economics, 41(1), 294-308.
19.Kędzior, M. (2012) “Capital structure in EU selected countries – micro and macro determinants”, Argumenta Oeconomica, 28, 69–117.
20.Khemiri, W. & Noubbigh, H. (2018), “Determinants of capital structure: evidence from sub-Saharan African firms”, The Quarterly Review of Economics and Finance, 70 (11), 150-159.
21.Köksal, B., & Orman, C. (2015). Determinants of capital structure: evidence from a major developing economy. Small Business Economics, 44, 255-282.
22.Korkmaz, Ö. (2016). The effects of profitability ratios on debt ratio: The sample of the BIST manufacturing industry. Financial Studies, 20(2).
23.Kraus, A., & Litzenberger, R. H. (1973). A state-preference model of optimal financial leverage. The journal of finance, 28(4), 911-922.
24.Kuč, V., & Kaličanin, Đ. (2021). Determinants of the capital structure of large companies: Evidence from Serbia. Economic Research-Ekonomska Istraživanja, 34(1), 590-607.
25.Li, L., & Islam, S.Z. (2019), "Firm and industry-specific determinants of capital structure: evidence from the Australian market", International Review of Economics and Finance, 59 (1), 425-437.
26.Li, X. M., & Qiu, M. (2021). The joint effects of economic policy uncertainty and firm characteristics on capital structure: Evidence from US firms. Journal of International Money and Finance, 110, 102279.
27.Malinic, D., Dencic-Mihajlov, K., & Ljubenovic, E. (2013). The determinants of capital structure in emerging capital markets: Evidence from Serbia. European Research Studies, Vol. XVI, Issue (2), pp. 98-119.
28.Malinić, D., Milićević, V., & Glišić, M. (2015). Do the best: Performing Serbian companies create value?. Ekonomika preduzeća, 63(7-8), 337-353.
29.Modigliani, F., & Miller, M. H. (1958). The cost of kapital, corporation finance and the theory of investment. The American economic review, 48(3), 261-297.
30.Modigliani, F., & Miller, M. H. (1963). Corporate income taxes and the cost of kapital: a correction. The American economic review, 433-443.
31.Mokhova, N., & Zinecker, M. (2014). Macroeconomic factors and corporate capital structure. Procedia-Social and Behavioral Sciences, 110, 530-540.
32.Moradi, A. & Paulet, E. (2019), “The firm-specific determinants of capital structure–An empirical analysis of firms before and during the Euro Crisis”, Research in International Business and Finance, 47 (1), 150-161.
33.Myers, S. C., & Majluf, N. S. (1984). Corporate financing and investment decisions when firms have information that investors do not have. Journal of financial economics, 13(2), 187-221.
34.Paredes Gómez, A., Ángeles Castro, G., & Flores Ortega, M. (2016). Determinants of leverage in mining companies, empirical evidence for Latin American countries. Contaduría y administración, 61(1), 26-40.
35.Psillaki, M., & Daskalakis, N. (2009). Are the determinants of capital structure country or firm specific?. Small business economics, 33, 319-333.
36.Ramli, N.A., Latan, H. & Solovida, G.T. (2019), “Determinants of capital structure and firm financial performance—a PLS-SEM approach: evidence from Malaysia and Indonesia”, The Quarterly Review of Economics and Finance, 71 (2), 148-160.
37.Raval, A., & Dave, A. (2021). The empirical study of association of capital structure and profitability of telecommunication firms. Biosci. Biotechnol. Res. Commun, 14, 190-193.
38.Roodman, D. (2009). How to do xtabond2: An introduction to difference and system GMM in Stata. The stata journal, 9(1), 86-136.
39.Saif-Alyousfi, A. Y., Md-Rus, R., Taufil-Mohd, K. N., Mohd Taib, H., & Shahar, H. K. (2020). Determinants of capital structure: evidence from Malaysian firms. Asia-Pacific Journal of Business Administration, 12(3/4), 283-326.
40.Sbeti, W. M., & Moosa, I. (2012). Firm-specific factors as determinants of capital structure in the absence of taxes. Applied Financial Economics, 22(3), 209-213.
41.Sofat, R. and Singh, S. (2017), “Determinants of capital structure: an empirical study of manufacturing firms in India”, International Journal of Law and Management, 59 (6), 1029-1045.
42.Stöckl, M., & Winner, H. (2013). Körperschaftsbesteuerung und Unternehmensverschuldung: Evidenz aus einem Europäischen Firmenpanel/Capital Structure and Corporate Taxation: Empirical Evidence from European Panel Data. Jahrbücher für Nationalökonomie und Statistik, 233(2), 188-205.
43.Sun, C., Zhang, Z., Vochozka, M., & Vozňáková, I. (2022). Enterprise digital transformation and debt financing cost in China? s A-share listed companies. Oeconomia Copernicana, 13(3), 783-829.
44.Tulcanaza Prieto, A. B., & Lee, Y. H. (2019). Internal and external determinants of capital structure in large Korean firms. Global Business & Finance Review (GBFR), 24(3), 79-96.
Objavljeno u
Vol. 32 No. 2 (2026)
Ključne reči
Licenca
Ovaj rad je objavljen pod Creative Commons Attribution 4.0 International (CC BY 4.0).
Autori zadržavaju autorska prava nad svojim radom.
Dozvoljena je upotreba, distribucija i adaptacija rada, uključujući i u komercijalne svrhe, uz obavezno navođenje originalnog autora i izvora.
Zainteresovani za slična istraživanja?
Pregledaj sve članke i časopise