Improvements in Network Lifetime for Solar-Powered Nodes in Wireless Sensor Networks

Abstract
Wireless sensor networks with specific hardware configuration and possibilities for their network lifetime improvement are examined in this paper. Nodes in the network are equipped with solar cells. Storing solar energy in batteries is a very cost-effective and long- lasting solution for sensor nodes that are difficult to reach for regular maintenance. Solar power provides more power for more frequent data acquisition and greater communication distance. The downside of this approach is battery lifetime, not a single charge lifetime but the total overall number of times battery can be recharged before it fails. Here we propose a design of the whole sensor node configuration and, most importantly, hardware and software improvements of sensor nodes for increasing battery life and thus network lifetime. A survey of relevant literature is provided, as well as the analysis of experimental data from referenced authors. Some experiments have been done to discuss the testing methods of other researchers. Good results in improving network lifetime for most used battery types were obtained by this research. Network lifetime of wireless sensor networks can be doubled or even tripled by modifying battery charging strategies, which would enable up to ten years of maintenance-free operation of sensor nodes. Partial charging strategies present a significant improvement in increasing Li-ion battery cycle-count expectancy and can also increase calendar-life expectancy because of batteries not being kept at elevated states of charge.
Article
Introduction
Environmental monitoring, machine control, traffic sensing, and patient health monitoring are only some of the applications of wireless sensor networks (WSN). These networks consist of multiple nodes, up to thousands. Nodes are preferably small, low power devices usually consisting of a microcontroller unit (MCU), sensors, a radio communication device and a power supply. Sensor nodes (SN) connect wirelessly to each other and ultimately to a sink node that is directly connected to a base station (BS). The base station is usually a computer that acts as a monitoring and control centre. It can also serve as a gateway to the internet, enabling the whole system to become a part of the Internet of things (IoT) concept, which in turn enables users to monitor and control their WSN system from anywhere in the world (Deretić et al., 2023).
Our areas of interest for the application of WSNs are large agricultural estates with sensor nodes spanning tens of kilometres away from the base station. Environmental monitoring implies sensing of air and soil humidity, air and soil temperature, water level in reservoirs, air quality and movement detection. Such data are gathered with readily available sensors connected to a microcontroller. Every sensor node is powered by a battery and has a solar panel for recharging that battery, as shown in Figure 1.
Figure 1: Proposed configuration of SN components
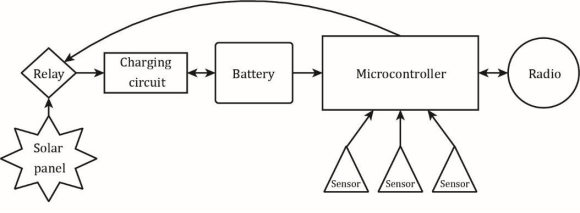
Source: Authors
Power from the solar panel goes through the relay to provide power for the charging circuit, which is connected to the battery. The battery is the source of power for the microcontroller and all of its attached peripherals. Whenever there is power coming from the solar panel, the charging circuit will try to charge the battery fully. Commercial charging solutions are based on the presumption that the user will always want to charge the battery fully to be able to use its full capacity. Manufacturers of Li-ion batteries state the expected cycle-life based on full-charge/full-discharge usage. Researches on battery aging in electric vehicles done in Sweden (Wikner & Thiringer, 2018) and Costa Rica (Pérez et al., 2017) show that partitional charging can extend battery life by up to 130% and 70%, respectively. Another study in China claims a 300% increase in life expectancy for partitional charging (Gao et al., 2018). These partitional charging strategies used a traditional constant-current constant-voltage (CC-CV) profile. Further improvements can be achieved by managing the cell charging process to achieve a pre-defined rate of battery degradation per charge cycle (Koleti et al., 2019), an optimization of the conventional CC-CV charging protocol (Maia et al., 2019) and 5- stage constant-current charging strategy (Jiang et al., 2019).
Because of ever-increasing demand for food, large-scale agricultural properties are becoming almost impossible to cultivate without modern technology and automation. In the future, automation will heavily rely on environmental monitoring for the purpose of energy-efficient land cultivation. For example, there will be no need for artificial watering of land at times when sensor nodes sense satisfactory levels of soil humidity. Problems occur when sensor nodes die and automation systems do not get the needed pieces of information. That can lead to increased expenditures for watering or even dying of crops because of not watering. Sensor nodes will shut down when their batteries come to the end of their cycle-life and need replacement. Replacing those batteries becomes expensive on large properties with hundreds of sensor nodes, not only for the cost of batteries themselves but also for the cost of personnel getting to remote locations to change them for the new ones. Having batteries replaced every 6-9 years instead of every 3 years presents significant savings in agricultural production.
Batteries are the main part of the system that is preventing sensor nodes from having decades-long autonomy (Sukuman et al., 2023). Other parts of the system should, theoretically, last indefinitely. In this paper, every component of the system will be analysed and considered for improvement with the highest power efficiency in mind, and SN design solutions will be recommended that are both power efficient and economic.
System components
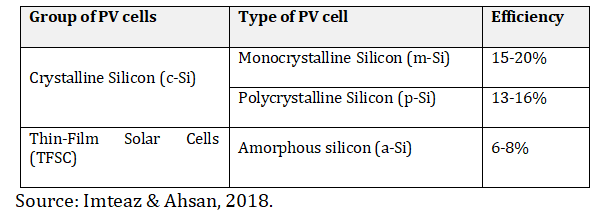
Photovoltaic solar cells are one of the cleanest renewable energy sources in use today. They create no pollution and require no maintenance during their service life. Crystalline silicon, concentrator, and thin-film are main groups of photovoltaic solar cells in production today. Among these, the main types of solar cells in widespread use are thin-film silicon, cadmium-telluride, and crystalline silicon - which are the most popular and they are produced using polycrystalline and monocrystalline material. Monocrystalline cells are the most efficient and the most expensive. Polycrystalline photovoltaic cells are the most used worldwide. They are just a few percents less efficient than the monocrystalline cells but they are less expensive. Their efficiency is from 13-16%. Some researchers claim higher efficiencies up to 30-70% but that technology is not yet at the commercial-stage (Miles et al., 2005).
We will use a lower efficiency of 13% for estimating power generation for sensor nodes. Amorphous cells are worth mentioning but they have relatively low efficiency which drops even further after only a few years of use. They have the advantage of being able to work in cloudy conditions with lower efficiency drop than other types. They are much harder to acquire today and their price is growing in recent years. A comparison of efficiencies of different photovoltaic technologies is given in Table 1.
Table 1: Efficiency comparison of most used PV cells
Photovoltaic Geographical Information System (PVGIS) of the European commission’s Joint research centre has an excellent website with an interactive calculator for determining solar irradiation for a given geographical location (PVGIS, 2023). The city of Ljubljana, Slovenia was chosen because average solar irradiation on that location presents an approximate average for Europe. It was decided to fix the solar panel at an angle of 70 degrees, which is the optimal angle for the most critical month - December (Figure 2).
Figure 2: Average hourly data for solar irradiation in Ljubljana (Slovenia) for a fixed incline of 70 degrees
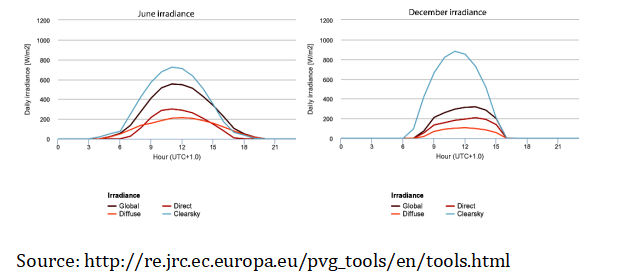
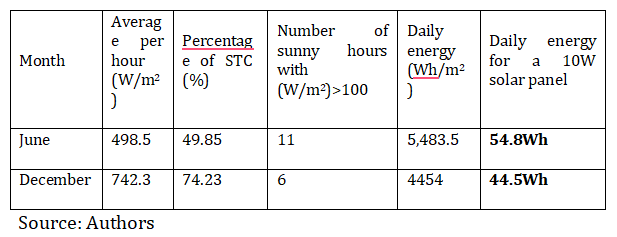
Most manufacturers quote the solar power output at Standard Test Conditions (STC), at a panel temperature of 25°C and the solar irradiation of 1,000W/m2. Exporting raw hourly data from a calculator (PVGIS, 2023) into a table (Table 2), it can be seen that the irradiance is less than optimal (per STC) and hence it can be calculated how much power can be expected on a daily basis from a 10W solar panel (Table 3). Numbers in red on Table 2 present values of power that are too low for power generation from a solar panel and are not considered as useful.
These calculations give a rough estimate of available power for a solar panel of 10W. Solar panel’s fixed incline of 70 degrees from a horizontal plane will give us poor overall efficiency but the best possible efficiency for the most critical month - December.
Table 2: Average solar irradiation in Ljubljana per hour for June and December
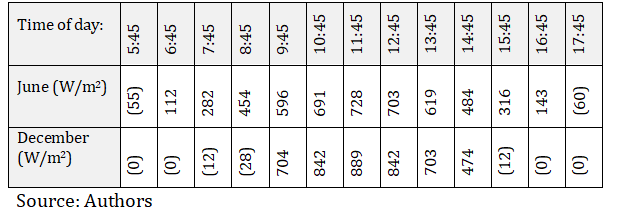
Table 3: Cumulative daily power expected from a 10W solar panel on the location of interest for June and December, calculated for sunny hours with (W/m2)>100
In Figure 1 a relay is shown as part of the circuit that cuts the current coming from the solar panel when the battery is charged to the desired voltage. In practice, it can be a transistor switch or a solenoid relay. When activated, they all consume current until MCU decides to stop charging the battery. This current is not negligible in comparison to MCU’s current consumption.
The best approach is to use a latching relay, a relay that has two stable states. It only consumes current when toggling between states. For solar applications in WSN where charging power does not exceed a few watts, a small 2 amp latching relay would suffice as it consumes only 120mW for less than one second when toggling between states. It would be directly powered from MCU’s I/O pins. For larger systems with higher charging currents more powerful latching relays should be used. MCU would not be able to provide high enough current for driving such relays so a relay-driver circuit would be recommended. If standard low power relay consumes 30mA at 3V (90mW) for 8 sunny hours while the battery is being charged, it amounts to 0.72Wh per day. Latching relay consumes power only twice daily for one second, 0.00013Wh per day, 5,500 times less than a regular non-latching relay.
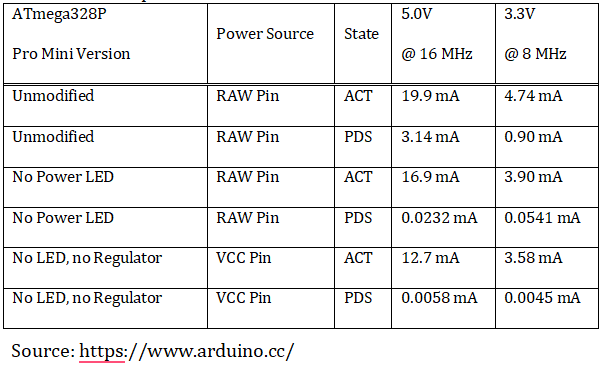
A microcontroller is a small, low-cost and self-contained computer- on-a-chip that can be used as an embedded system. They must have low-power requirements since many devices they control are battery-operated (Sampson, 2022). Microcontrollers are characterized by bus-width, instruction set, and memory structure. The main types in use today are 8052 series by Intel, which is becoming obsolete, PIC series by Microchip Technology Inc. (Mazidi et al., 2008) and AVR series by Atmel (acquired by Microchip in 2015., Atmel Corporation, 2009). We chose AVR series of microcontrollers for our project since they are versatile (Slade et al., 2011), widely available, affordable and most importantly they have a large community of users that regularly contribute to the development of programming code and peripherals. The most practical way of using AVR microcontroller is through Arduino platform, which is an open-source platform based on Atmel chips (Popović et al., 2017). There are many models of Arduino boards: Uno, Mega, Nano, Pro Mini and many more. The Arduino Pro Mini model was chosen for the research, which provides adequate computing power and requires low supply voltage, making it suitable for battery operation (http://store.arduino.cc/, accessed 15.03.2023). This microcontroller board is based on Atmel ATmega328P chip.
The power consumption of the unmodified board (5V and 3.3V models) was measured in active and sleep mode and then the power LED indicator and onboard voltage regulator were removed and the results stated in Table 4. The RAW pin is the power input that gets regulated by the onboard voltage regulator, which is not very efficient, whereas VCC is the input that expects the externally regulated voltage, 5.0 or 3.3 volts. Current of 3.9mA (at 3.3V) will be consumed in this case for maximum computing power and control, which is 0.013W or 0.3Wh per 24 hours.
Table 4: Comparison of power requirements of different models and modes of operation of Arduino Pro Mini
Communication is provided through a radio module the selection of which is an important part of achieving low power and long-range requirements. LoRa radio modules were eventually selected as they conform to IEEE 802.15.4 standard and use a license-free radio frequency band of 868MHz for Europe. They are based on SX1278 chips made by Semtech and achieve a communication range in excess of 10km in open areas. Their power consumption is 120mA (0.41W at 3.3V) at maximum power transmission. Power consumption in WSN nodes strongly depends on communication protocols used, TEEN and LEACH being the most attractive for this implementation (Arora et al., 2016) due to their communication quality and power conservation. Communication will be established for 3 minutes every hour to send and receive data, which amounts to 0.02Wh of energy consumption per hour, or 0.5Wh per 24 hours.
Charging technologies differ by the type of batteries they are designed to charge. The lead-acid battery has been the technology of choice for most photovoltaic applications for decades. In recent times their energy density to weight ratio makes them much heavier and bulkier than their Li-ion counterparts. They use more space for their application and their weight results in bigger transport and replacement costs. As Li-ion technologies progress and their price per kWh drops, they will make lead-acid technology obsolete in near future. That is why we are suggesting using lithium-ion technologies for remote sensor nodes. When using electronic devices or when charging batteries with solar power as the energy source, it is widely accepted that the maximum power point tracking (MPPT) technology yields the best results in harvesting solar energy, the next best option being pulse width modulation charging (Fang et al., 2018). Every solar panel has its maximum power point (MPP), which is a point of maximum power delivery at a voltage/current curve and is given as a voltage value at which we can consume certain current. If we try to consume more current from a solar panel, the voltage will drop and so will the power and the efficiency. MPPT chargers will allow the load to consume a maximum amount of current without sacrificing power efficiency. Since microcontrollers are used in sensor nodes they can, at the same time, be used to track the MPP of the solar cell and to control battery charging (Goksenli & Akbaba, 2016).
Lead-acid has been the battery technology of choice for solar applications for decades. This type of battery is the least energy- dense battery, which is not a problem for home solar applications, but for WSN applications they are too heavy and cumbersome. Depending on usage, their lifespan is anywhere from one to a few years.
Pioneering work on lithium batteries began in 1912. The development of rechargeable lithium batteries began in 1970s but progressed slowly until 1991 when Sony commercialized the first rechargeable Li-ion battery. Further development enabled cost reduction, increased specific energy and absence of toxic materials, all of which made Li-ion a low-maintenance battery that has low self-discharge and does not need an occasional full discharge to keep it in good shape. The drawbacks of Li-ion technology are high price and the need for protection circuits to prevent overcharge and over-discharge. Most widely used types of Li-ion batteries are (Yao, 2016):
- Lithium Cobalt Oxide (LiCoO2 or LCO),
- Lithium Manganese Oxide (LiMn2O4 or LMO),
- Lithium Nickel Manganese Cobalt Oxide (LiNiMnCoO2 or NMC),
- Lithium Iron Phosphate (LiFePO4 or LFP),
- Lithium Nickel Cobalt Aluminum Oxide (LiNiCoAlO2 or NCA),
- Lithium Titanate (Li4Ti5O12 or LTO).
Models of battery operation can be divided into mathematical, electrochemical, and equivalent-circuit models. Mathematical models describe the battery behaviour based on the State of Charge (SOC – the ratio between the stored energy and the battery capacity), State of Health (SOH – Battery’s performance compared to manufacturer specifications) and other macroscopic properties (Ali et al., 2017; Gonzalez-Castellanos et al., 2019). Electrochemical models describe battery behaviour based on the physical and chemical processes in the cell. These models are very accurate but have a high computational cost. Equivalent-circuit models are based on laboratory measurements for battery cell representation.
An important aspect of battery operation is aging. Two main causes of Li-ion battery aging are charge-discharge cycles and calendar time (Waag et al., 2014). Cycle aging refers to the total number of times a battery can be fully charged and discharged until capacity fades to 80% of capacity rated for a new battery. For example, it is stated in the datasheet for NCR18650PF battery (https://www.powerstream.com/p/INR18650-25R-datasheet.pdf, accessed 10.03.2023) that after 500 charge-discharge cycles capacity will fade from 2900mAh to 2300mAh, which is a 20% capacity loss. Except for charge-discharge cycling, all other processes that lead to the degradation of a battery contribute to calendar time aging (Karger et al., 2023).
Most Li-ion batteries are equipped with Over-charge/Over- discharge/Over-current safety circuits. The Overcharge Safety function: the charge stops when the voltage per cell rises above
4.25±0.05V and the charge restarts when the voltage per cell falls below 4.10±0.05V (Ali et al., 2023). The Overdischarge Safety function: the discharge stops when the voltage per cell falls below
2.5±0.1V and the discharge restarts when the voltage per cell rises above 2.9±0.1V (https://industrial.panasonic.com/cdbs/www- data/pdf/ACA4000/ACA4000PE4.pdf, accessed 15.03.2023). Overcharge and over-discharge voltages may be different than the above-stated values, depending on the manufacturer of the protection circuit. Safety circuits are integrated into the battery or provided as a standalone circuit and they protect the battery from extreme conditions that should never be reached. Panasonic recommends that the ambient temperature of the battery during charge should not exceed a lower limit of 10°C and a higher limit of 45°C. This is an important factor to consider when designing a battery-operated sensor node that will be exposed to environmental conditions.
Battery State of Charge (SOC) can be estimated by two techniques: the Coulomb counting method and the Open Circuit Voltage (OCV) method (Lee & Won, 2023; Kadem & Kim, 2023). SOC is expressed as the percentage of the energy left in a battery with respect to its available capacity - a battery with 100% SOC is fully charged. The OCV method uses the correlation between the OCV and the electrolyte concentration that varies with SOC and this is represented by an OCV-SOC plot, which is supposed to remain the same during the lifetime of the battery, i.e. it does not depend on the age of the battery (Snihir et al., 2006). Figure 3 shows the OCV- SOC plot as an average for 9 tested batteries of NCR18650GA type (Lee et al., 2008). The OCV-SOC relation is also stable with variation of temperatures (Huria et al., 2012; Renxin et al., 2023).
Figure 3: OCV-SOC plot for NCA battery
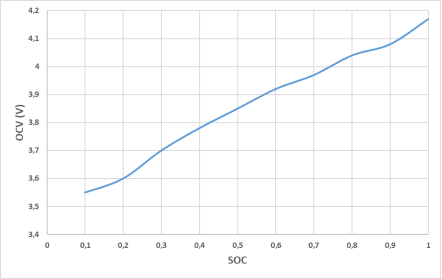
Source: Ovejas Benedicto, 2017.
This OCV-SOC plot is measured for a specific model of Sanyo (Panasonic) battery. Other types of Li-ion chemistries will have different plots, which is important to consider when programming the charging and discharging termination voltages into a microcontroller, discussed later in this paper. The State of Health (SOH) of the battery can be defined as the ratio (in percents) of the present capacity of the battery and its nominal capacity (Sun et al., 2023).
Li-ion batteries with 3.7V nominal voltage are required to be charged to 4.2V to reach 100% capacity. This is true for LCO, NMC, LMO and NCA Li-ion chemistries. When they are fully discharged, they reach voltages from 3.0-3.4V. Manufacturers claim a life expectancy of 500 charge-discharge cycles with Depth of Discharge (DOD) of 100%. That means that after 500 cycles the battery will have 80% SOH. Phosphate based batteries have a nominal voltage of 3.2V and 1000-2000 cycles of life expectancy. Titanate based batteries have 2.4V nominal voltage and several thousands of charge-discharge cycles of life expectancy.
Cycle aging and Experimental results
Research has been done in which the aging mechanisms of batteries cycled under various SOC ranges were investigated (Gao et al., 2018). A control set of batteries was cycled at 100% DOD. Other five groups of batteries were cycled at 20% DOD: 0-20%, 20- 40%, 40-60%, 60-80% and 80-100% SOC. Because the control group had almost five times the throughput capacity of partitioned SOC intervals of 20% the capacity degradation results could not be compared directly. Therefore, for the cycling under 20% DOD, the equivalent full cycle time is calculated by normalizing the accumulated throughput capacity during the cycle process with battery nominal capacity. The decline rates of capacity under the five partitioned SOC intervals are sorted in descending order: [80%, 100%] > [20%, 40%] > [40%, 60%] ≈[60%, 80%] > [0, 20%].
This led to the conclusion that battery capacity degrades gently in the range of 0-20% SOC and, on the contrary, degrades considerably in the range of 80-100% SOC. After 2,800 charge- discharge cycles maximum available capacity degradation is 6% for 0-20% SOC interval and 19% for 0-100% SOC interval. That is three times less capacity loss for partial charge-discharge cycling, which means that the battery will have its capacity decreased by 20% in three times the number of cycles claimed by the manufacturer, excluding the calendar time aging processes.
Very interesting results have been obtained in research on batteries used in electric vehicles (Pérez et al., 2017). In testing, researchers used only 70% of total battery capacity in comparison to the 100% SOC swing range. Their results show that cycling the battery between 70% and 0% SOC gives a 70% increase in lifespan compared to cycling the battery between 100% and 30% SOC, which corresponds to the previously described work done by Gao et al.
At the University of Technology in Sweden, research was conducted on the impact of battery aging when using various SOC levels for electric vehicles (Wikner & Thiringer, 2018). It was concluded that using a reduced charge level of 50% SOC increased the life expectancy of the vehicle battery by 44-130% (depending on C-rates). Discharge rates of 0.5C, 1C, and 2C were used for measurements, and DOD of 10% at upper SOC levels of 30%, 50%, and 90%. For usage in sensor nodes, we will consider only 0.5C results because in our case discharge currents will be much lower comparing to the battery capacity. At 20-30% SOC swing the battery will lose only 3% of its capacity after 5000 cycles, at 40- 50% it will lose 10% and at 80-90% SOC swing it will lose 18% of capacity. For 20% DOD at upper SOC of 50% capacity loss after 5000 cycles is 4%.
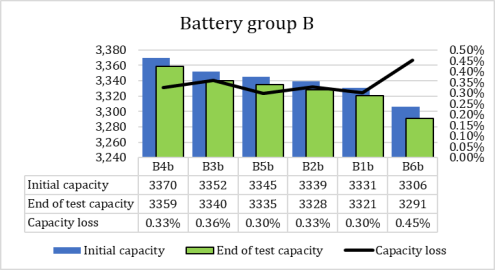
The first author of this paper has conducted experiments in July and August of 2023 to confirm the findings of referenced authors. Twelve new NCR18650B batteries made by Panasonic were used in experiments. Their capacity was measured at the beginning and end of the experiment by MiBoxer C4 Smart Charger. They were cased in an aluminum enclosure exposed to direct sunlight to create the worst-case conditions. With no wind, during the hottest summer days, the enclosure reached a maximal temperature of 55°C. Six batteries were fully charged daily starting at noon with
4.2V end of charge voltage (A group) and for the other six batteries (B group) charging was stopped when they reached 3.7V, which corresponds to 50% of their capacity. Group A was fully discharged to 2.9V daily with a load of 600mA (~0.2C), and group B to 3.5V (30% capacity) with 60mA (~0.02C) load. The results are shown in Figure 4 for group A and in Figure 5 for group B.
Average capacity loss after 50 cycles is 2.45% for group A, and 0.34% for group B. If we presume the capacity loss trend is linear, then group A will lose 24.5% of capacity after 500 cycles. That is 4.5% more capacity loss than predicted by the manufacturer, but this is expected due to elevated charging and storage temperatures. With the same presumption of linear capacity loss group B will lose only 3.4% of capacity after 500 cycles. These predictions do not include calendar aging. The results are a little better (lower capacity loss) than the results of the researches of the articles referenced earlier in this chapter, but that may be because the batteries used in this test were of high quality and temperatures were elevated for only a few hours per day.
An interesting finding is that the capacity loss was bigger for batteries B5a and B6b that had lower initial capacity than stated by the manufacturer, which is 3350mAh. This might be due to inconsistencies in the production process. A bigger sample size for the experiment would produce a smaller margin of error and might show this finding to be just a coincidence. These two batteries increased the average capacity loss for both groups, which leads the author to the conclusion that the initial capacity should also be taken into account when designing battery-operated systems.
Figure 4: Capacity loss after 50 charge/discharge cycles with 0- 100% capacity swing
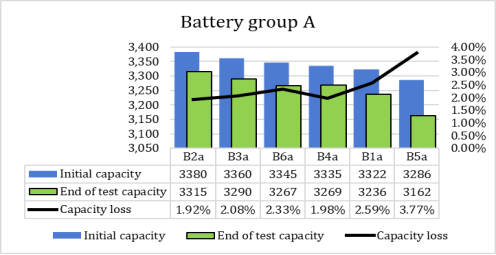
Figure 5: Capacity loss after 50 charge/discharge cycles with 30- 50% capacity swing
Calendar aging is the degradation of the battery over time with the battery being stored under Open Circuit Potential (OCP) conditions. Li-ion batteries will lose capacity over time even when they are not being used (Grolleau et al., 2014; Karger et al., 2023). There are two sets of processes that result in two types of the capacity loss in the cell over time: reversible and irreversible capacity loss (Barré et al., 2013). Two predominant causes of calendar aging are the effect of temperature and the effect of the state of charge (Capkova et al., 2023).
When stored at high temperatures, secondary reactions occur in a battery, such as corrosion which induces the loss of cyclable lithium (Kassem et al., 2012). In experiments on calendar aging (Grolleau et al., 2014), Li-ion cells were aged at three different storage temperatures, which resulted in the following capacity fades (Xie & Manthiram, 2020; Krupp et al., 2022):
- fully charged cells stored at 30°C: 10% capacity loss after 450 days,
- fully charged cells stored at 45°C: 20% capacity loss after 450 days,
- fully charged cells stored at 60°C: 20% capacity loss after only 60 days.
Keil et al., (2016) have performed an extensive calendar aging study focusing on the dependency of the storage SoC on the capacity degradation. They experimentally found that every type of tested battery has a specific storage SOC point below which the capacity fade is almost constant for a ten months period. These specific storage SOC points are given for three different Li-ion chemistries: NCA (58%), NMC (62%) and LFP (72%). Below these storage SOC points capacity fade was around 3% (for 25°C ambient temperature) and above that the capacity fade was doubled (Keil et al., 2016). The same tests for a 50°C ambient temperature resulted in a lot bigger capacity fade: NCA (8%), NMC (12%) and LFP (12%).
Cells stored at the same temperature but at different states of charge do not age in the same manner (Estevez et al., 2023). Batteries stored at elevated SOCs have a significant number of lithium-ions available at the graphite electrode to partake in potential side reactions with the electrolyte and thus experience increased cell degradation compared to those stored at lower SOCs (Ohue et al., 2011). Samsung states in their INR18650-25R battery datasheet (https://www.powerstream.com/p/INR18650-25R- datasheet.pdf, accessed 10.03.2023) that storing the battery for 50 days at 60°C temperature will decrease battery capacity by 8%. Storing Li-ion batteries at extremely low temperatures (0°C or lower) will not speed up the ageing process but will lower the immediately available amount of power in the battery by ~5% (https://www.powerstream.com/p/INR18650-25R-datasheet.pdf, accessed 10.03.2023). For the lowest possible degradation during transport, manufacturers ship their batteries at 40% SOC.
Proposed solutions
We have established in section “System components” that we have a minimum of 44Wh of available power from a 10W solar panel on a sunny day. From the numbers stated in sections about “Microcontroller”, “Radio communication” and “Battery charging circuit”, we can compute the power consumption of a relay, microcontroller, and radio device to a sum of 0.8Wh per day. If we assume a potential maximum of 7 consecutive cloudy days when solar panel efficiency will fall to 10% of that for a sunny day, we need 7x0.8Wh=5.6Wh of energy stored in a battery in every moment for continuous operation of a sensor node.
For the best conservation of battery health, we want to cycle the battery in the range of around 40% of its capacity. Cycling the battery between 30% and 50% SOC will cause the least amount of cycle and calendar aging. With 20% DOD dedicated to regular use, equalling 5.6Wh, the total battery capacity for our system needs to be at least 28Wh. Battery charged at 50% SOC will power the system for seven days until it reaches 30% SOC and needs a recharge. If the battery is at 30% when cloudy days start, we will have reserve energy between 0-30% SOC for 10.5 cloudy days. This means that the autonomy of our proposed system is from 10.5 to 17.5 days without charging.
According to all the referenced research and our experiments described in chapter 2.7, this partial charging method can prolong the battery life at least twice. Using the number of 500 charge- discharge cycles for LCO, NMC and NCA batteries with normal charging, partial charging will give us at least 1000 cycles. With charging every seven days, this gives us a theoretical limit of 7000 days of battery life or 19 years. This is only theoretical limit because after a few years calendar aging of cells will become the dominant aging factor.
Using three Li-ion cells with 3000mAh capacity in a parallel configuration will give us a capacity of 33.3Wh, which is 19% more than we need (28Wh). Using numbers from section about “Calendar aging”, we will have a 3% of yearly capacity fade. That gives us 6 years of battery usage before the capacity fades to the required 28Wh. Even then we will have another 6 years until the capacity fades enough to leave the battery with 60% of its original capacity. That will only lead to more frequent battery charging (every 4 days instead of 7) and a smaller amount of reserve for cloudy days, around 7 instead of 10.5.
Temperature is one of the two dominant factors that contribute to calendar aging. Sensor nodes are usually mounted on a pole to increase the height for better environmental sensing and radio communication. Batteries can be housed in the base of the pole, or even better - underground. That will reduce the ambient temperature variations which influence the batteries so that the temperature will be around 10-20°C all year long. This kind of battery placement will reduce calendar aging as much as partial charge-discharge cycling.
A microcontroller will be used to control the charging of the battery exactly the way we need it. For the microcontroller to accurately measure the voltage of the battery, it needs a voltage reference because the voltage of the battery is fluctuating from
4.2V to 3.3V (for an LCO cell). For a voltage reference, an internal reference or a zener diode can be used, but a much more precise solution would be using a TL432 or LM336 voltage reference Integrated Circuit (IC). This IC outputs an exact voltage of 2.5V with 1% tolerance. MCU senses the battery voltage on one of its analog inputs and compares it to the reference voltage on another input. Now the MCU derives the exact voltage of the battery. Looking at Figure 3 we can see that the voltage of an NMC battery is 3.85V for a SOC of 50% and 3.7V for 30%. The MCU controls the relay which enables the battery charging circuit and when the battery voltage drops to 3.7V the charging starts. At 3.85V the relay opens and charging stops. OCV-SOC plot from Figure 3 changes as the battery ages and we can experimentally determine the difference in those voltages and program the MCU code to implement this change in charge-discharge routine after a certain number of cycles. That way we will always start the charge and discharge processes at right SOC levels.
The pulse charging algorithm is also seen as a promising battery charging technique to satisfy the need to have increased battery charge and energy efficiencies (Gholipour et al., 2023). Life extension can be around 100 cycles or more depending on a careful choice of charge current parameters, duty cycle, and frequency.
Conclusion
Wireless sensor networks are the future of automation and monitoring in all branches of industry, and as such, they need to be reliable in the long term. Apart from the battery, all other parts of a sensor node system can, theoretically, last indefinitely. The weakest link in the chain is the battery. A system is proposed that will at least double the battery life with a minimal part count and expenditure. A library for Atmel ATmega328P microcontroller will be written so as to control the charge-discharge parameters by simply entering the capacity and type of battery the user wishes to implement.
All battery cycle aging tests referenced in this article deal with higher discharge currents because they were aimed at the automotive industry. More cycle aging tests have to be done for the IoT usage where the current consumption is relatively low compared to the battery capacity, i.e. 0.001C to 0.1C.
Calendar aging is not mentioned in battery datasheets by manufacturers, and users would greatly benefit from that data for designing their systems. Calendar aging has not been sufficiently tested, so all improvements in cycle-aging will not be enough by themselves to prolong the battery life if batteries chemically deteriorate before the end of their cycle life. As batteries are improved year after year and new types of chemistries emerge, new tests have to be done to satisfy the user’s need to have the relevant data at hand for designing and implementation of their battery-operated systems.
References
2.Ali, Y., Shah, I., Khan, T. A., & Iqbal, N. (2023). A Multiphysics- Multiscale Model for Particle–Binder Interactions in Electrode of Lithium-Ion Batteries. Energies, 16(15), 5823. doi: 10.3390/en16155823.
3.Arora, V. K., Sharma, V., & Sachdeva, M. (2016). A survey on LEACH and other’s routing protocols in wireless sensor network. Optik, 127(16), 6590-6600. doi: 10.1016/j.ijleo.2016.04.041.
4.Atmel Corporation. (2009). 8-bit Microcontroller with 4/8/16/32K Bytes In-System Programmable Flash. 1-26.
5.Barré, A., Deguilhem, B., Grolleau, S., Gérard, M., Suard, F., & Riu,
D. (2013). A review on lithium-ion battery ageing mechanisms and estimations for automotive applications. Journal of power sources, 241, 680-689. doi: 10.1016/j.jpowsour.2013.05.040.
6.Capkova, D., Knap, V., Fedorkova, A. S., & Stroe, D. I. (2023). Investigation of the temperature and DOD effect on the performance-degradation behavior of lithium–sulfur pouch cells during calendar aging. Applied Energy, 332, 120543. doi: 10.1016/j.apenergy.2022.120543.
7.Deretić, N., Popović, M., & Samardžić, N. (2023). Internet inteligentnih uređaja - Internet of things. Belgrade Business and Arts Academy of Applied Studies. https://plus.cobiss.net/cobiss/sr/sr/bib/128782857
8.Estevez, M. A. P., Conte, F. V., Tremonti, C., & Renzi, M. (2023). Aging estimation of lithium ion cells under real-world conditions through mechanical stress measurements. Journal of Energy Storage, 64, 107186. doi: 10.1016/j.est.2023.107186.
9.Fang, H., Depcik, C., & Lvovich, V. (2018). Optimal pulse- modulated lithium-ion battery charging: Algorithms and simulation. Journal of Energy Storage, 15, 359-367. doi: 10.1016/j.est.2017.11.007.
10.Gao, Y., Jiang, J., Zhang, C., Zhang, W., & Jiang, Y. (2018). Aging mechanisms under different state-of-charge ranges and the multi-indicators system of state-of-health for lithium-ion battery with Li (NiMnCo) O2 cathode. Journal of Power Sources, 400, 641-651. doi: 10.1016/j.jpowsour.2018.07.018.
11.Gholipour, M. R., Saradarzadeh, M., & Farhangi, S. (2023). Wireless power transfer pulse charging of lithium-ion battery. Journal of Energy Storage, 72, 108402. doi: 10.1016/j.est.2023.108402.
12.Goksenli, N., & Akbaba, M. (2016). Development of a new microcontroller based MPPT method for photovoltaic generators using Akbaba model with implementation and simulation. Solar Energy, 136, 622-628. doi: 10.1016/j.solener.2016.07.037.
13.Gonzalez-Castellanos, A. J., Pozo, D., & Bischi, A. (2019). Non- ideal linear operation model for li-ion batteries. IEEE Transactions on Power Systems, 35(1), 672-682. doi: 10.1109/TPWRS.2019.2930450.
14.Grolleau, S., Delaille, A., Gualous, H., Gyan, P., Revel, R., Bernard, J., Redondo-Iglesias, E., Peter, J., & Network, S. I. M. C. A. L. (2014). Calendar aging of commercial graphite/LiFePO4 cell– Predicting capacity fade under time dependent storage conditions. Journal of Power Sources, 255, 450-458. doi: 10.1016/j.jpowsour.2013.11.098.
15.https://actec.dk/media/documents/70FC46554038.pdf
16.https://industrial.panasonic.com/cdbs/www- data/pdf/ACA4000/ACA4000PE4.pdf
17.https://store.arduino.cc/
18.https://www.powerstream.com/p/INR18650-25R- datasheet.pdf
19.Huria, T., Ceraolo, M., Gazzarri, J., & Jackey, R. (2012, March). High fidelity electrical model with thermal dependence for characterization and simulation of high power lithium battery cells. In 2012 IEEE International Electric Vehicle Conference (pp. 1-8). IEEE. doi: 10.1109/IEVC.2012.6183271.
20.Imteaz, M. A., & Ahsan, A. (2018). Solar panels: Real efficiencies, potential productions and payback periods for major Australian cities. Sustainable energy technologies and assessments, 25, 119-
125. doi: 10.1016/j.seta.2017.12.007.
21.Jiang, L., Li, Y., Huang, Y., Yu, J., Qiao, X., Wang, Y., Huang, C., & Cao, Y. (2020). Optimization of multi-stage constant current charging pattern based on Taguchi method for Li-Ion battery. Applied Energy, 259, 114148. doi: 10.1016/j.apenergy.2019.114148.
22.Kadem, O., & Kim, J. (2023). Real-time state of charge-open circuit voltage curve construction for battery state of charge estimation. IEEE Transactions on Vehicular Technology, 8613- 8622. doi: 10.1109/TVT.2023.3244623.
23.Karger, A., Schmitt, J., Kirst, C., Singer, J. P., Wildfeuer, L., & Jossen, A. (2023). Mechanistic calendar aging model for lithium- ion batteries. Journal of Power Sources, 578, 233208. doi: 10.1016/j.jpowsour.2023.233208.
24.Kassem, M., Bernard, J., Revel, R., Pelissier, S., Duclaud, F., & Delacourt, C. (2012). Calendar aging of a graphite/LiFePO4 cell. Journal of Power Sources, 208, 296-305. doi: 10.1016/j.jpowsour.2012.02.068
25.Keil, P., Schuster, S. F., Wilhelm, J., Travi, J., Hauser, A., Karl, R. C., & Jossen, A. (2016). Calendar aging of lithium-ion batteries. Journal of The Electrochemical Society, 163(9), A1872–A1880. doi: 10.1149/2.0411609jes.
26.Koleti, U. R., Zhang, C., Malik, R., Dinh, T. Q., & Marco, J. (2019). The development of optimal charging strategies for lithium-ion batteries to prevent the onset of lithium plating at low ambient temperatures. Journal of Energy Storage, 24, 100798. doi: 10.1016/j.est.2019.100798.
27.Krupp, A., Beckmann, R., Diekmann, T., Ferg, E., Schuldt, F., & Agert, C. (2022). Calendar aging model for lithium-ion batteries considering the influence of cell characterization. Journal of Energy Storage, 45, 103506. doi: 10.1016/j.est.2021.103506.
28.Lee, S., Kim, J., Lee, J., & Cho, B. H. (2008). State-of-charge and capacity estimation of lithium-ion battery using a new open- circuit voltage versus state-of-charge. Journal of power sources, 185(2), 1367-1373. doi: 10.1016/j.jpowsour.2008.08.103.
29.Lee, J., & Won, J. (2023). Enhanced coulomb counting method for SoC and SoH estimation based on coulombic efficiency. IEEE Access, 11, 15449-15459. doi: 10.1109/ACCESS.2023.3244801.
30.Maia, L. K., Drünert, L., La Mantia, F., & Zondervan, E. (2019). Expanding the lifetime of Li-ion batteries through optimization of charging profiles. Journal of cleaner production, 225, 928-938. doi: 10.1016/j.jclepro.2019.04.031.
31.Mazidi, M. A., Mazidi, J., McKinlay, R., & Ingendorf, P. (2005). PIC microcontroller and embedded systems. Prentice-Hall, Inc.
32.Miles, R. W., Hynes, K. M., & Forbes, I. (2005). Photovoltaic solar cells: An overview of state-of-the-art cell development and environmental issues. Progress in crystal growth and characterization of materials, 51(1-3), 1-42. doi: 10.1016/j.pcrysgrow.2005.10.002.
33.Ohue, K., Utsunomiya, T., Hatozaki, O., Yoshimoto, N., Egashira, M., & Morita, M. (2011). Self-discharge behavior of polyacenic semiconductor and graphite negative electrodes for lithium-ion batteries. Journal of power sources, 196(7), 3604-3610. doi: 10.1016/j.jpowsour.2010.12.073.
34.Ovejas Benedicto, V. J. (2017). Determination of the state of health of Li-ion batteries: the irreversible entropy production approach. TDX (Tesis Doctorals en Xarxa).
35.Perez, A., Quintero, V., Rozas, H., Jimenez, D., Jaramillo, F., & Orchard, M. (2017, October). Lithium-ion battery pack arrays for lifespan enhancement. In 2017 CHILEAN Conference on Electrical, Electronics Engineering, Information and Communication Technologies (CHILECON) (pp. 1-5). IEEE. doi: 10.1109/CHILECON.2017.8229537.
36.Popović, T., Latinović, N., Pešić, A., Zečević, Ž., Krstajić, B., & Djukanović, S. (2017). Architecting an IoT-enabled platform for precision agriculture and ecological monitoring: A case study. Computers and electronics in agriculture, 140, 255-265. doi: 10.1016/j.compag.2017.06.008.
37.PVGIS. Photovoltaic Geographical Information System of European commission’s Joint research center. Solar irradiation online calculator. http://re.jrc.ec.europa.eu/ pvg_tools/en/tools.html
38.Renxin, X., Yanwen, H., Wei, Z., & Zhaohui, C. (2023). A novel approach to estimate the state of charge for lithium-ion battery under different temperatures incorporating open circuit voltage online identification. Journal of Energy Storage, 67, 107509. doi: 10.1016/j.est.2023.107509.
39.Sampson, A. (2022). Computer System, Organisation an Architecture. Bibliotex, Canada.
40.Slade, M., Jones, M. H., & Scott, J. B. (2011). Choosing the right microcontroller: A comparison of 8-bit Atmel, Microchip and Freescale MCUs. Faculty of Engineering, The University of Waikato. https://hdl.handle.net/10289/5938.
41.Sukumar, R., Alam, I., & Dore, A. (2023, December). Challenges of Automation and Robotics in Engineering. In 2023 International Conference on Power Energy, Environment & Intelligent Control (PEEIC) (pp. 913-918). IEEE. doi: 10.1109/PEEIC59336.2023.10451276.
42.Sun, X., Zhang, Y., Zhang, Y., Wang, L., & Wang, K. (2023). Summary of health-state estimation of lithium-ion batteries based on electrochemical impedance spectroscopy. Energies, 16(15), 5682. doi: 10.3390/en16155682.
43.Snihir, I., Rey, W., Verbitskiy, E., Belfadhel-Ayeb, A., & Notten, P.
H. (2006). Battery open-circuit voltage estimation by a method of statistical analysis. Journal of Power Sources, 159(2), 1484- 1487. doi: 10.1016/j.jpowsour.2005.11.090.
44.Waag, W., Fleischer, C., & Sauer, D. U. (2014). Critical review of the methods for monitoring of lithium-ion batteries in electric and hybrid vehicles. Journal of Power Sources, 258, 321-339. doi: 10.1016/j.jpowsour.2014.02.064.
45.Wikner, E., & Thiringer, T. (2018). Extending battery lifetime by avoiding high SOC. Applied Sciences, 8(10), 1825. doi: 10.3390/app8101825.
46.Xie, Q., & Manthiram, A. (2020). Long-life, ultrahigh-nickel cathodes with excellent air storage stability for high-energy density lithium-based batteries. Chemistry of Materials, 32(17), 7413-7424. doi: 10.1021/acs.chemmater.0c02374.
47.Yao, L. (2016). Online Modelling and State-Of-Charge Estimation for Lithium-Titanate Battery (Doctoral dissertation, Universiti Teknologi Malaysia).
http://eprints.utm.my/84073/1/LowWenYaoPFKE2016.pdf
Published in
Vol. 30, No. 1, 2024.
Keywords
Licence
This work is published under the Creative Commons Attribution 4.0 International (CC BY 4.0).
Authors retain copyright over their work.
Use, distribution, and adaptation of the work, including commercial use, is permitted with clear attribution to the original author and source.
Interested in Similar Research?
Browse All Articles and Journals